
Powerful stock market analysis tool
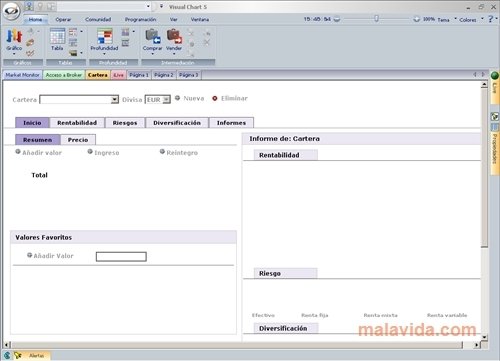
Managing our portfolio is something rather complex, the stock market can vary a lot in a matter of minutes, and due to that, it's necessary to always have some kind of notification that will allow us to know exactly what is happening and give us enough data to try to predict what will happen with our portfolio. Visual Chart is an application directly prepared for this purpose.
The software to invest on the stock market
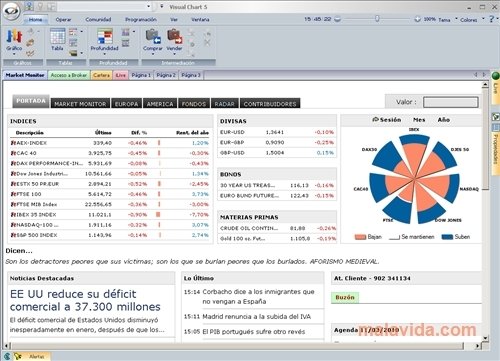
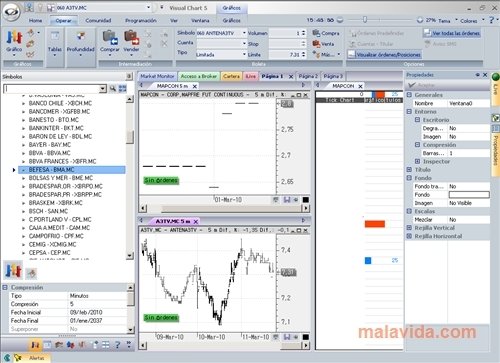
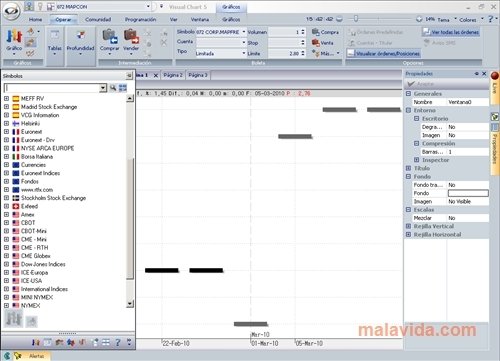
With Visual Chart we'll have several tools to analyze stock market movements on one interface, with sections to show information about each one of the values that we select, as well as all the volume of titles that each company controls. Everything is easily measurable, and it isn't complicated to plan strategies with the trading tools.
The application also includes a statistics section, because since it's a stock market analysis application, statistics and objective data are really important.
Become a true broker.
Furthermore, Visual Chart also uses the Internet connection to download business news, that could be very interesting for the user with regard to his/her investments, by means of the iLive service that the developing company provides.
 Elies Guzmán
With a degree in History, and later, in Documentation, I have over a decade of experience testing and writing about apps: reviews, guides, articles, news, tricks, and more. They have been countless, especially on Android, an operating system...

Antony Peel